A five-year total cost of ownership (TCO) model for accessibility supplies should combine acquisition, delivery, setup, staff time, maintenance, replacement, service continuity, and end-of-period recovery. Compare only options that meet the same guest need and property requirements. Then show both the undiscounted spending plan and the present value of future costs. A lower unit price is useful information, but it does not establish which acceptable option will cost less to keep available and ready for guests.
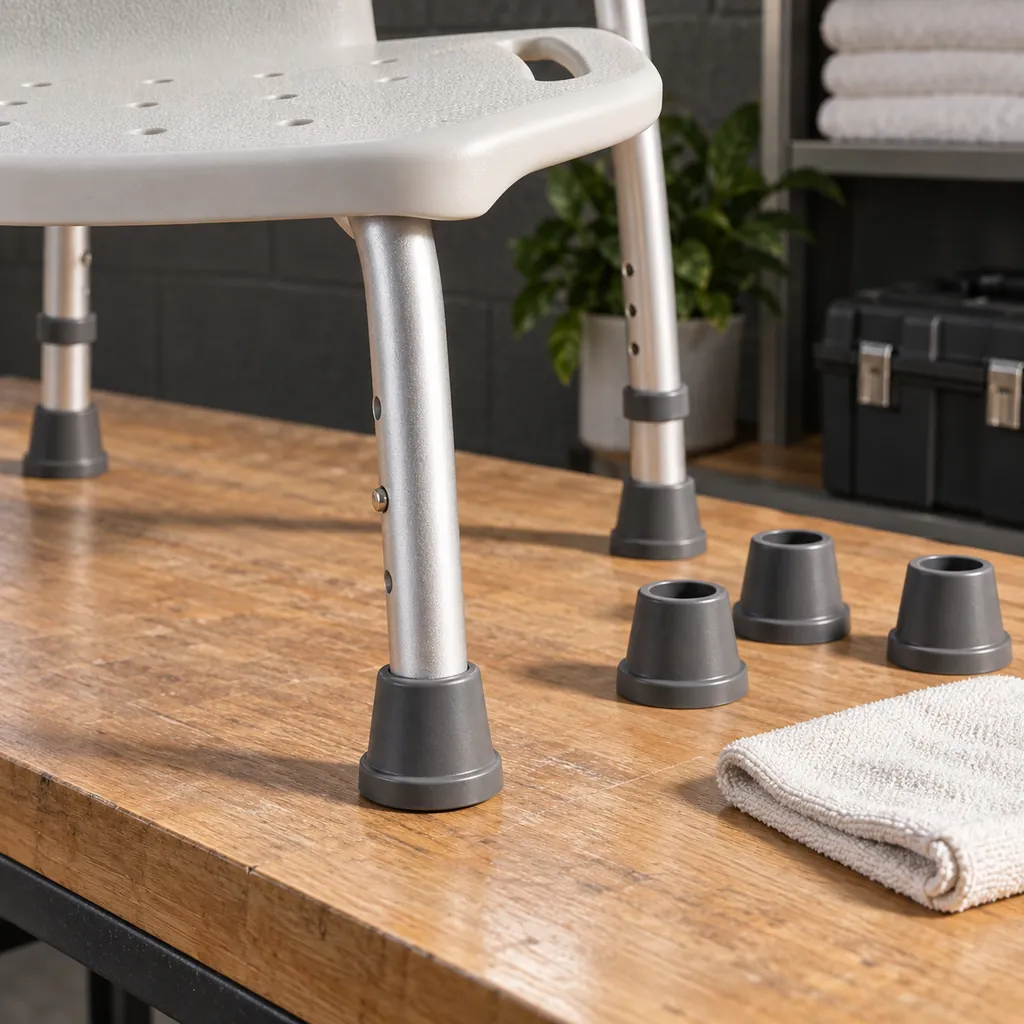
Accessibility supplies need a particularly careful cost boundary. A shower chair may require cleaning, inspection, storage, and occasional replacement of feet or other approved components. A portable communication aid may introduce batteries, compatibility checks, testing, and staff handover. Permanently installed equipment adds site preparation and installation dependencies. Combining these items under one average replacement rate can conceal the very costs the purchasing team needs to understand.
This guide is for hotel owners, procurement managers, engineering teams, housekeeping leaders, and finance staff comparing supply options for an opening, renovation, or replenishment program. It focuses on the economics of delivering an already-defined level of accessibility. It does not determine required quantities, certify a product, or replace a property-specific review of applicable requirements. Properties in different markets should establish their own acceptance criteria before comparing costs.
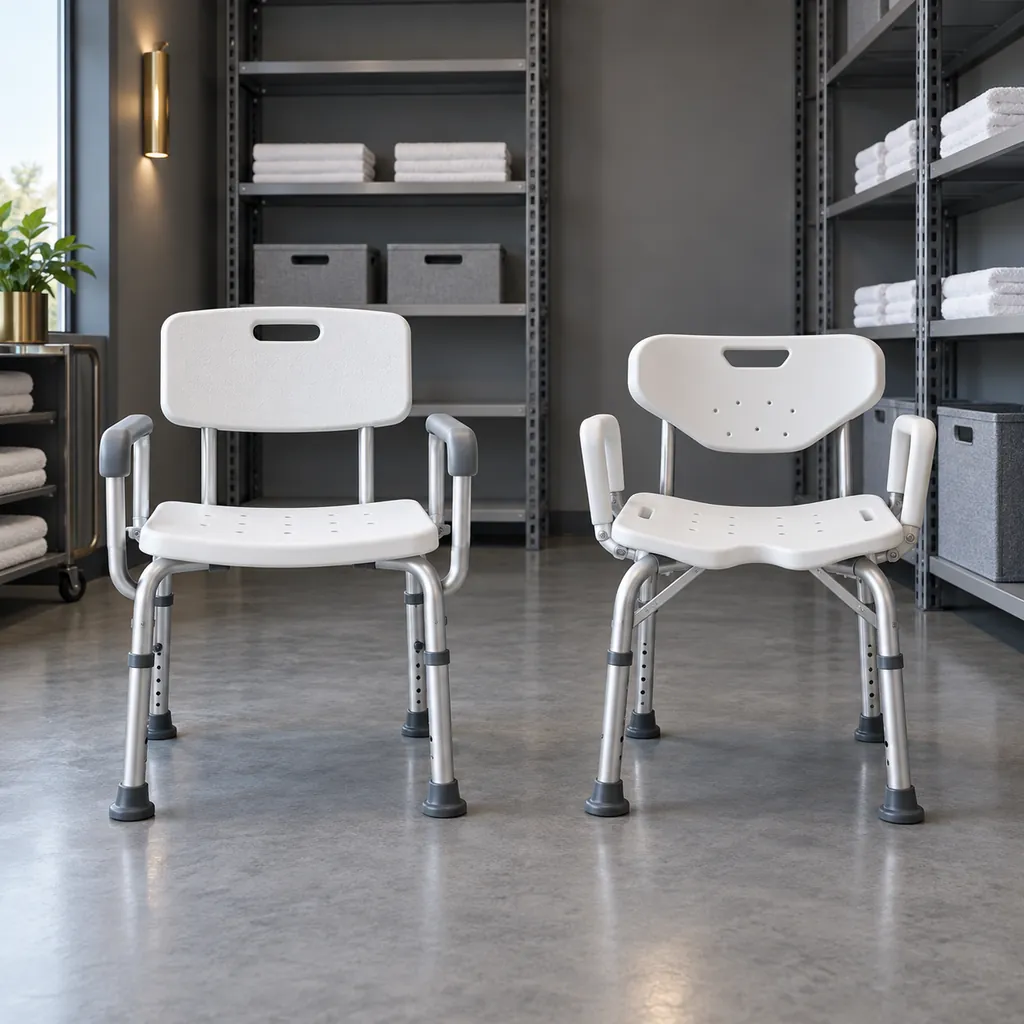
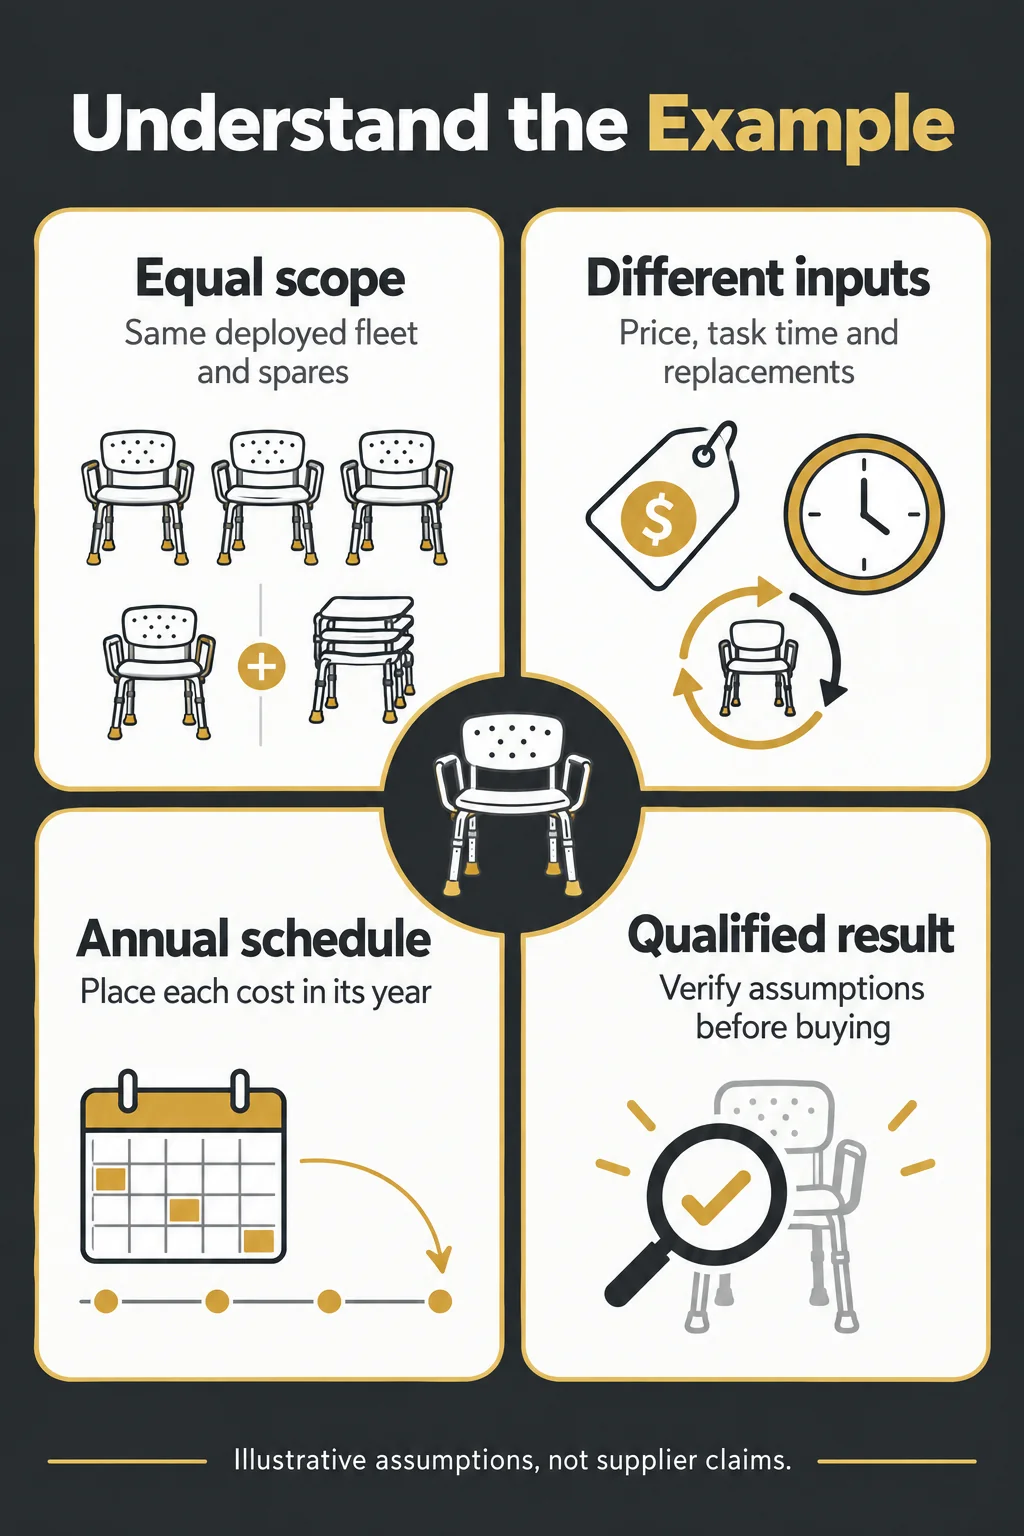
The worked example uses a hypothetical pool of portable shower chairs, priced in US dollars, with ten deployed units and two operational spares. Every price, labor assumption, replacement quantity, and recovery value is illustrative. None represents a KW Hospitality quotation, measured product performance, or an industry benchmark. The accompanying editable workbook lets buyers replace those assumptions with their own evidence, inspect annual cash flows, and see how the result changes when cleaning time, replacement timing, or the discount rate changes.
Define Comparable Accessibility Outcomes Before Comparing Costs
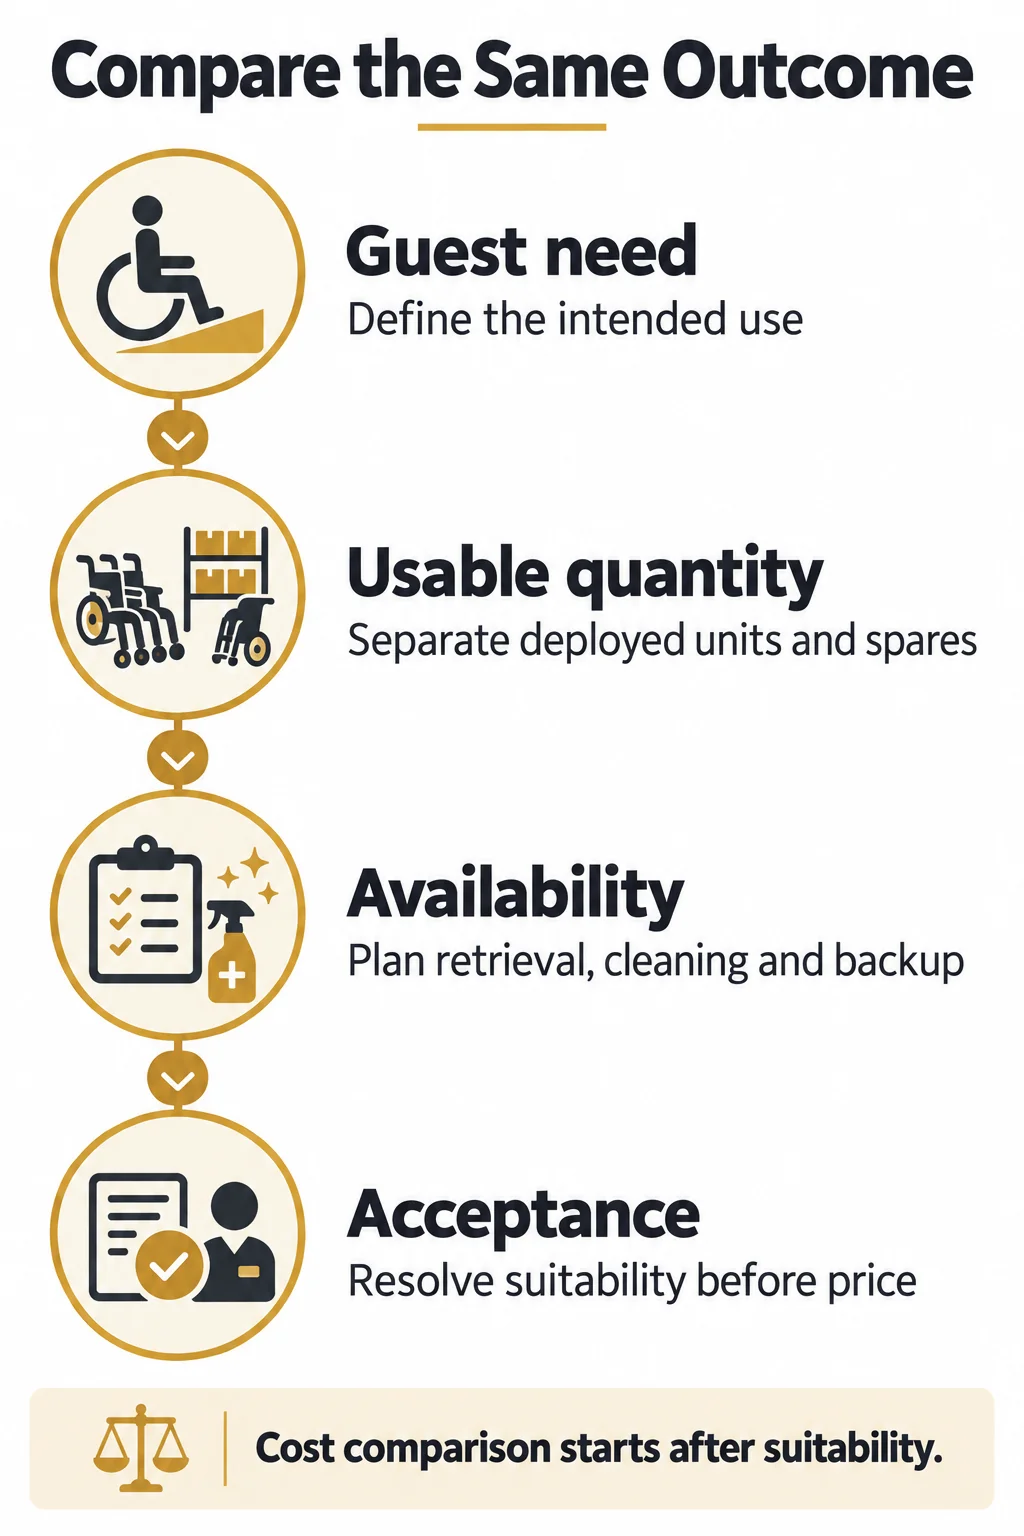
A useful TCO comparison begins with an equivalent service outcome: the same type of guest need, usable quantity, availability target, deployment setting, and acceptance criteria. A cheaper chair with an unsuitable load rating or incompatible dimensions is not an economic alternative to an acceptable chair. Likewise, a portable item cannot automatically replace a required installed feature. Record these boundaries before entering prices. Within the acceptable set, distinguish differences that affect cost from differences that require a separate operational judgment. This prevents the model from assigning a financial reward to a product that cannot safely or reliably perform the intended role.
Separate the product families
Build a separate schedule for each family before rolling costs up to a property total. Bathing aids, communication devices, mobility support items, and powered or installed equipment have different operating drivers. Pool-lift installation, for example, should not be estimated by copying the setup allowance for a portable shower chair. Use the actual product instructions and site scope to define relevant work.
| Product family | Cost driver to capture | Evidence to request |
| Portable bathing aids | Cleaning, inspection, storage, component replacement | Approved cleaning method, dimensions, load rating, parts list |
| Portable communication aids | Batteries, testing, compatibility, staff handover | Device compatibility, operating instructions, service terms |
| Powered or installed equipment | Site work, commissioning, servicing, backup arrangements | Installation scope, maintenance schedule, local support quotation |
Hold the service boundary constant
Specify the deployed fleet and reserve quantity separately. In the example, twelve chairs are purchased, but only ten are deployed. The two spares support continuity during cleaning or repair. They are not counted as additional occupied-room capacity. The example assumes the fleet can meet the same demand under either option; it does not establish that twelve chairs are sufficient for any particular hotel.
Record where each item will be used, how it will be stored and issued, and who confirms that it is ready for use. Examine access to the item as well as the item itself. A product that is available in inventory but cannot be retrieved promptly can still create an operational failure.
Use the guest room safety and accessibility review to organize the wider property review. Keep unresolved requirements outside the financial ranking until they are resolved. A budget model should never treat an unmet accessibility requirement as an optional saving.
Build the Five-Year Cost Schedule Without Double Counting
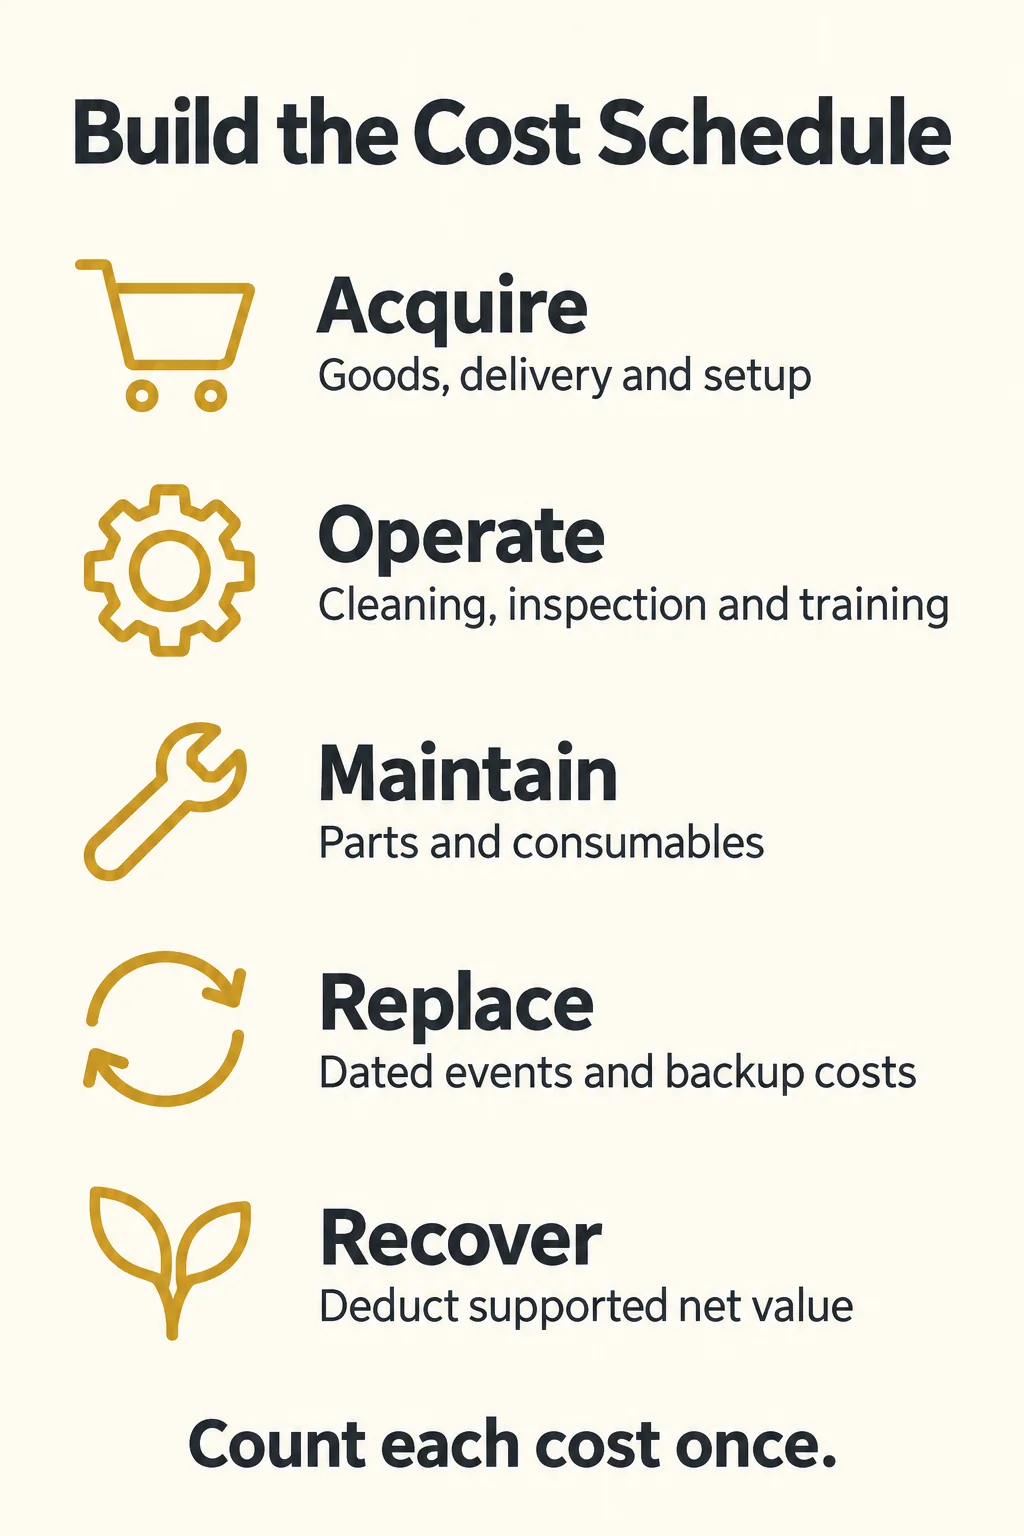
Organize the model around when money is spent and what work the property must perform. Put acquisition and readiness costs in Year 0, then record annual operating costs and dated replacement events in Years 1 through 5. Show recoveries as separate offsets. Use the same currency, price basis, delivery boundary, and timing convention for every option. The example uses constant purchasing-power dollars and a matching illustrative real discount rate, with annual flows at year-end. This simplifies the comparison while leaving the operational assumptions visible. A separate nominal budget can be produced when the property needs future invoice amounts that include inflation.
Use a consistent formula
Undiscounted five-year TCO = Year 0 acquisition and readiness cost + total operating costs + total replacement and disruption costs − total recoveries.
Present-value TCO = Year 0 cost + Year 1 net cost ÷ (1 + r) + Year 2 net cost ÷ (1 + r)² + Year 3 net cost ÷ (1 + r)³ + Year 4 net cost ÷ (1 + r)⁴ + Year 5 net cost ÷ (1 + r)⁵. Here, r is the annual discount rate, and each net cost includes that year’s cash outflows less its recoveries. Use the same r for competing options.
For a nominal forecast, escalate each relevant cost and use a nominal discount rate. For a constant-dollar forecast, keep general inflation out and use a real discount rate. The relationship is (1 + nominal rate) = (1 + real rate) × (1 + general inflation rate). A property-approved rate should replace the example’s 5%; it is not a recommended financing rate.
| Cost category | Treatment | Common duplication to avoid |
| Purchase and delivery | Include the full agreed receiving-point scope once | Adding freight already included in the unit price |
| Setup and initial training | Year 0 unless work occurs later | Repeating initial training as an annual charge |
| Recurring staff work | Task volume × minutes ÷ 60 × loaded hourly rate | Counting the same inspection inside two tasks |
| Maintenance and replacement | Separate retained-unit repairs from whole-unit replacement | Applying full-fleet replacement after already replacing part of the fleet |
| Disruption and backup | Estimate incremental response costs from a defined event | Counting backup rental and avoided lost-room revenue for the same event |
| Recovery | Deduct net realized or supported economic recovery at the relevant date | Subtracting resale proceeds and remaining-use value for the same asset |
Make labor assumptions observable
Annual cleaning labor = cleaning events × minutes per event ÷ 60 × loaded hourly labor rate. Count events for the whole fleet, not guest nights automatically. A guest stay can require several tasks, and a stored spare may need a periodic check without a guest using it. Distinguish active staff time from passive drying or disinfectant contact time. Do not shorten the required cleaning process to create a modeled saving.
A reduction in modeled labor cost may represent released staff capacity rather than a payroll reduction. Show which interpretation applies. If staffing expense cannot change, the time saving can still matter operationally, but finance should not present all of it as cash removed from the payroll budget.
Place replacement and recovery in the right year
Use a cohort schedule when replacement patterns matter: opening fleet, replacements made in each year, and the surviving units from each purchase cohort. If units are replaced midway through a year, adjust their operating exposure when material. The simplified example places replacements at year-end and assumes no second replacement of those units within the horizon.
Warranty credits should reflect recoverable amounts under written terms, including exclusions, claim effort, and freight responsibility. A parts warranty does not automatically cover removal, labor, or temporary equipment. The bid normalization guide helps align quotation scope before costs enter this schedule.
Keep depreciation and a funded replacement reserve out of cash TCO when purchase and replacement spending are already included. Depreciation is an accounting allocation; a reserve is a funding decision. Adding either on top of the same asset purchases counts the asset twice. Include actual storage or insurance expense when incremental, but avoid adding a generic capital charge if the discount rate already represents the cost of capital.
Worked Example: Two Portable Shower-Chair Options
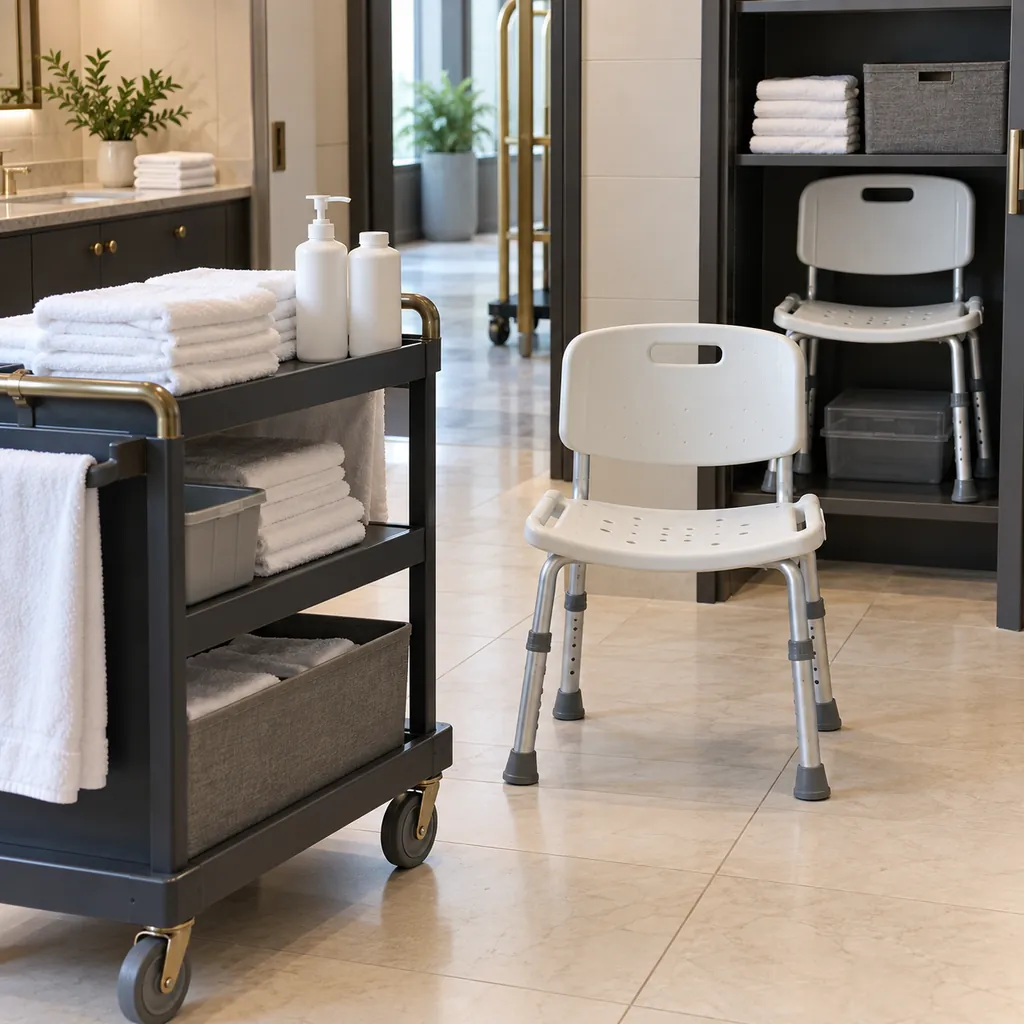
The example compares two assumed acceptable options serving the same twelve-unit pool for five years. Option A has a lower purchase price; Option B has an assumed shorter cleaning task and fewer replacement events. Both receive the same 600 fleet-wide cleaning events annually at a loaded labor rate of $30 per hour. These are planning assumptions to demonstrate the calculation, not claims about actual chairs. A product trial must establish whether the time difference is achievable while following the required cleaning method. Replacement counts also require evidence before they can support an award decision.
Opening and operating assumptions
| Assumption (USD unless noted) | Option A | Option B |
| Initial quantity | 12 | 12 |
| Unit purchase price | $180 | $260 |
| Initial delivery and nonrecoverable charges | $600 | $660 |
| Initial setup | $240 | $180 |
| Initial training | $300 | $300 |
| Year 0 total | $3,300 | $4,260 |
| Cleaning events per year, whole fleet | 600 | 600 |
| Active minutes per cleaning event | 8 | 5 |
| Loaded hourly labor rate | $30 | $30 |
| Annual cleaning labor | $2,400 | $1,500 |
| Annual inspection and refresher labor | $480 | $360 |
| Annual parts and consumables | $300 | $180 |
| Annual incremental disruption allowance | $240 | $120 |
| Annual recurring total | $3,420 | $2,160 |
| Planned replacement | 6 units at end of Year 3 | 2 units at end of Year 4 |
| All-in replacement cost per unit | $210 | $290 |
| Net recovery at end of Year 5 | $100 | $250 |
The all-in replacement price includes the new item, allocated delivery, setup, and disposal of the retired unit. The parts allowance applies to retained units and routine consumables; it excludes parts on units already covered by the whole-unit replacement event. The disruption allowance represents incremental retrieval, temporary provision, or response expense outside the cleaning and inspection lines. No lost revenue, speculative liability saving, or warranty recovery is included.
Annual costs and total result
| Period / measure | Option A | Option B |
| Year 0 | $3,300 | $4,260 |
| Year 1 | $3,420 | $2,160 |
| Year 2 | $3,420 | $2,160 |
| Year 3 | $4,680 | $2,160 |
| Year 4 | $3,420 | $2,740 |
| Year 5, net of recovery | $3,320 | $1,910 |
| Undiscounted TCO | $21,560 | $15,390 |
| Present-value TCO at 5% | $19,116.89 | $13,892.96 |
Option B requires $960 more at the start but has $6,170 less undiscounted five-year cost, a 28.6% reduction relative to Option A. Its present-value advantage is $5,223.94, calculated before rounding displayed totals. Annual recurring cost differs by $1,260. On that recurring difference alone, simple payback is about 0.76 years, or 9.1 months, if savings accrue evenly. Under the displayed year-end convention, cumulative savings first exceed the premium at the end of Year 1.
These results do not prove that a more expensive product is always better. They show which assumptions justify this particular premium. Five years is a comparison horizon, not an asserted service life. If assets remain usable after Year 5, assess a supported remaining-use value or extend the horizon. The example instead assumes a common fleet exit at Year 5 with the stated net recovery.
Use the editable model
The workbook contains the assumptions, six-period schedules, summary results, and a one-variable sensitivity calculation for cleaning time. Blue input cells are editable. Start by replacing the example inputs for both options, including timing and recoveries. A blank required input should be resolved rather than interpreted as zero. For multiple product families, create a separately controlled model for each family and consolidate matching-year results.
Test the Assumptions That Could Change the Decision
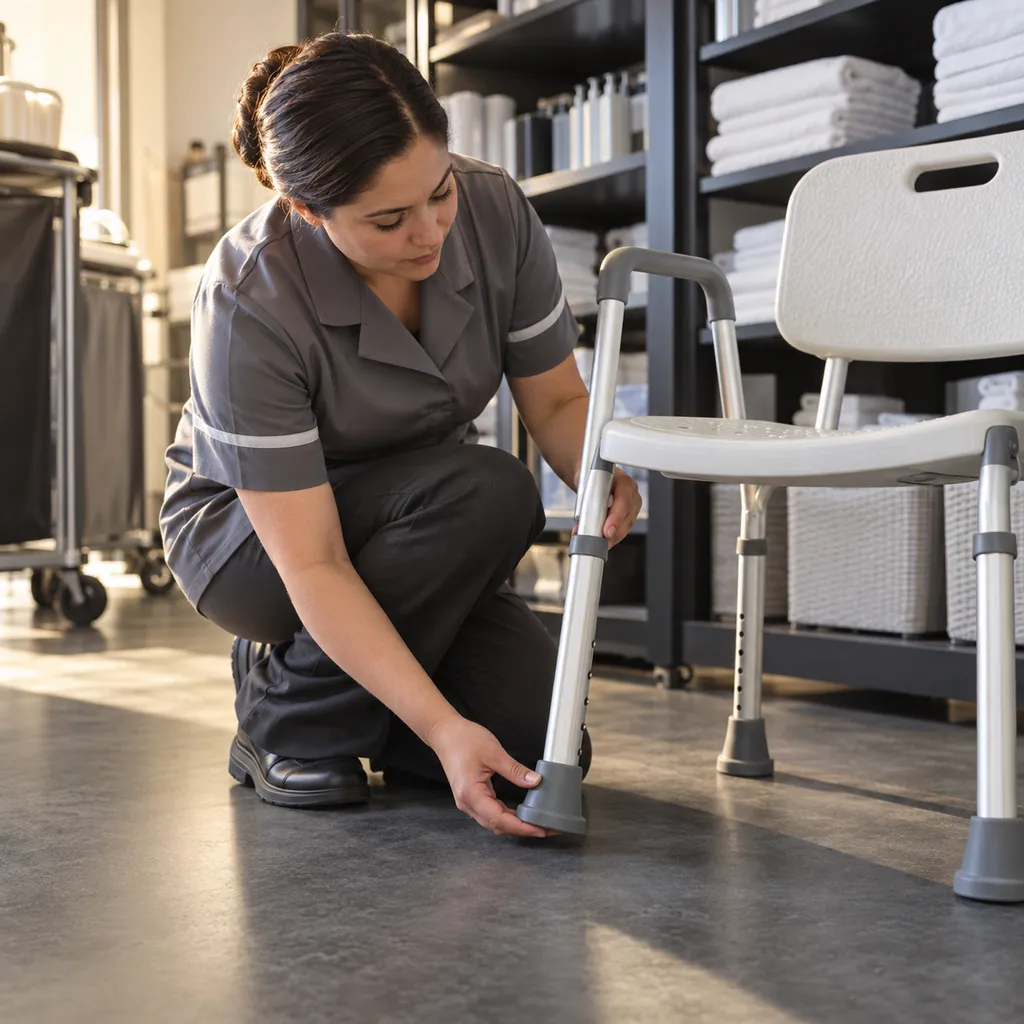
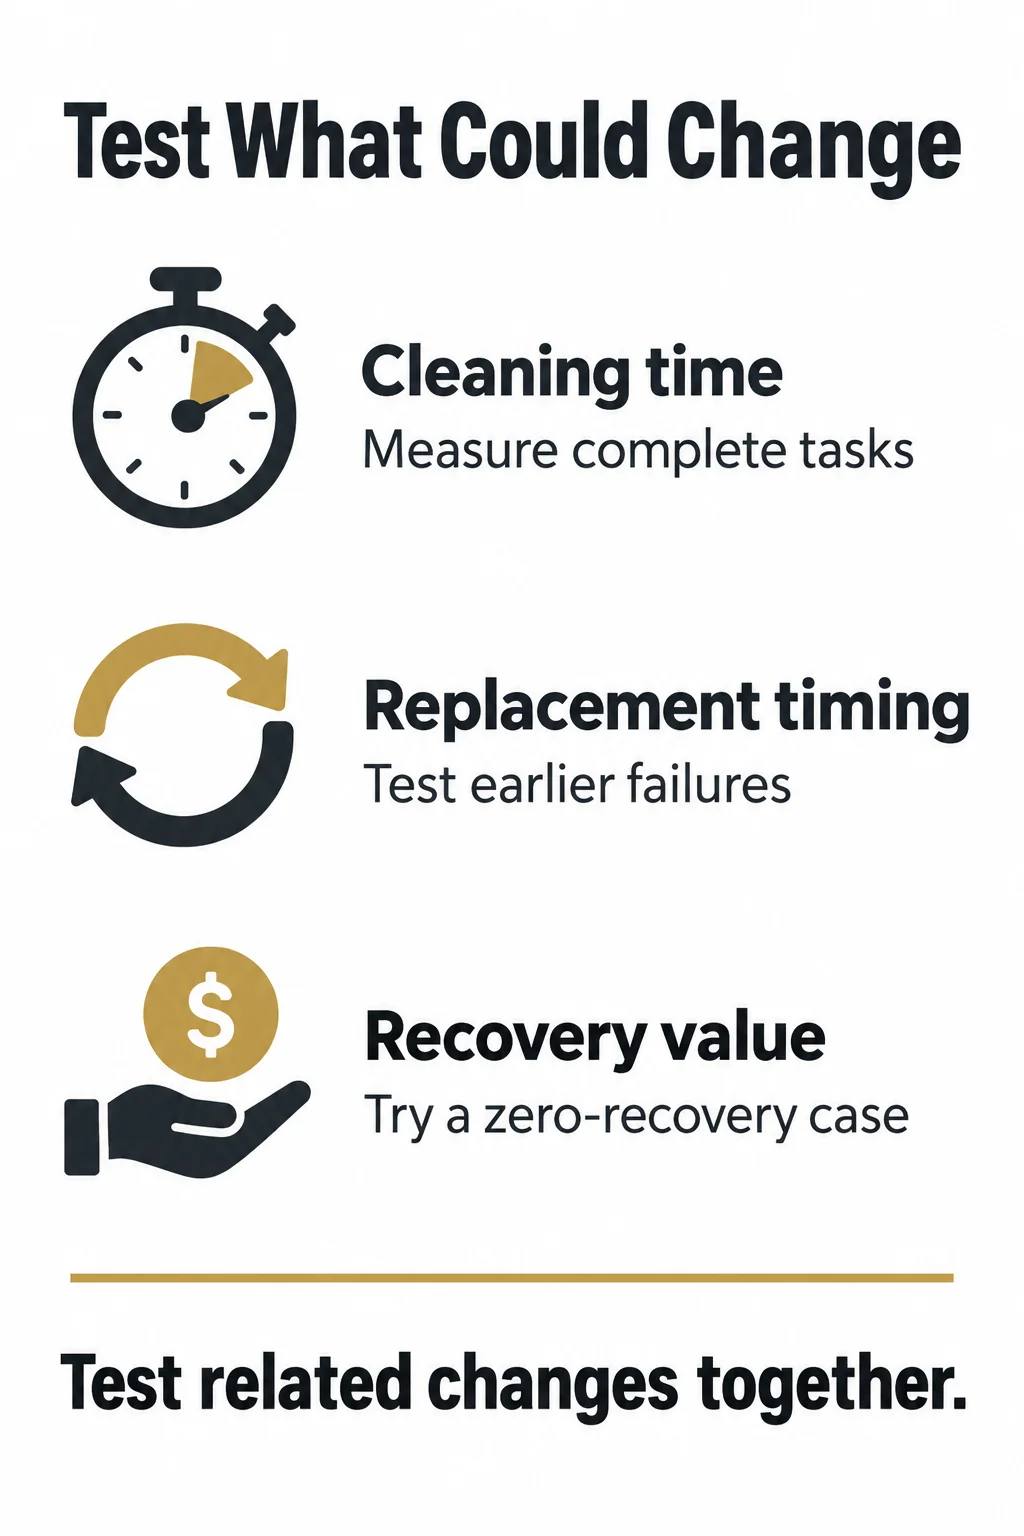
A TCO result is most useful when the team knows what could reverse it. Test uncertain inputs individually to identify influential assumptions, then combine related changes into coherent scenarios. Cleaning frequency and labor minutes often move together; replacement frequency and emergency support costs can also be related. An optimistic cleaning assumption paired with an unusually low failure allowance can make a bid appear stronger than the evidence supports. Keep the service outcome constant in every scenario. If an alternative stops meeting the property’s requirements, mark it as unsuitable rather than allowing a low total cost to keep it in the ranking.
Calculate the break-even cleaning time
At 600 annual events and $30 per hour, one additional minute per event costs $300 annually, or $1,500 over five undiscounted years. Holding every other example assumption fixed, Option B could absorb about 4.11 additional minutes per event before its $6,170 undiscounted advantage disappears. Its break-even cleaning time is therefore about 9.11 minutes instead of the assumed five. On a 5% present-value basis, the corresponding threshold is about 9.02 minutes. The workbook recalculates both thresholds.
Use this threshold as a trial-design question: is the measured Option B task time comfortably below the break-even level, across representative staff and complete cleaning cycles? Include preparation, active cleaning, handling, and reset consistently. Observe several cycles and document variation. A single demonstration cannot establish a reliable annual average.
Stress replacement, utilization, and recovery
| Change to the example | Undiscounted advantage for B | Interpretation |
| Base assumptions | $6,170 | B costs less under the stated plan |
| B cleaning time rises from 5 to 8 minutes | $1,670 | The recurring time advantage disappears |
| Both terminal recovery values are zero | $6,020 | Resale assumptions are not decisive here |
| A has no planned Year 3 replacement | $4,910 | B still costs less with A replacement removed |
| B takes 8 minutes and A has no planned replacement | $410 | The combined case leaves little room for other errors |
The combined case is more informative than treating each input as independent certainty. If a modest change in freight, service response, or labor allocation can erase a $410 margin, obtain better evidence before paying the premium. Also test lower cleaning demand and an earlier replacement of Option B. Do not convert these deterministic scenarios into probabilities without data.
Connect the model to the purchase and operating plan
Ask suppliers to separate initial delivery, spare parts, replacement-unit pricing, warranty remedies, and any local service charges. Request price validity dates and substitution controls. Match the approved sample and specification to the quoted model revision. An appealing TCO forecast is weak if future orders can arrive with different components or cleaning requirements.
After deployment, record task duration, repair cause, downtime, replacement quantity, and net recoveries against the model. Assign housekeeping ownership of cleaning assumptions, engineering ownership of inspection and service data, procurement ownership of prices and lead times, and finance ownership of the calculation basis. Refresh the forecast when evidence changes, especially after a product revision or repeated failure. Keep accessibility service failures visible even when their financial effect is difficult to estimate.
Conclusion
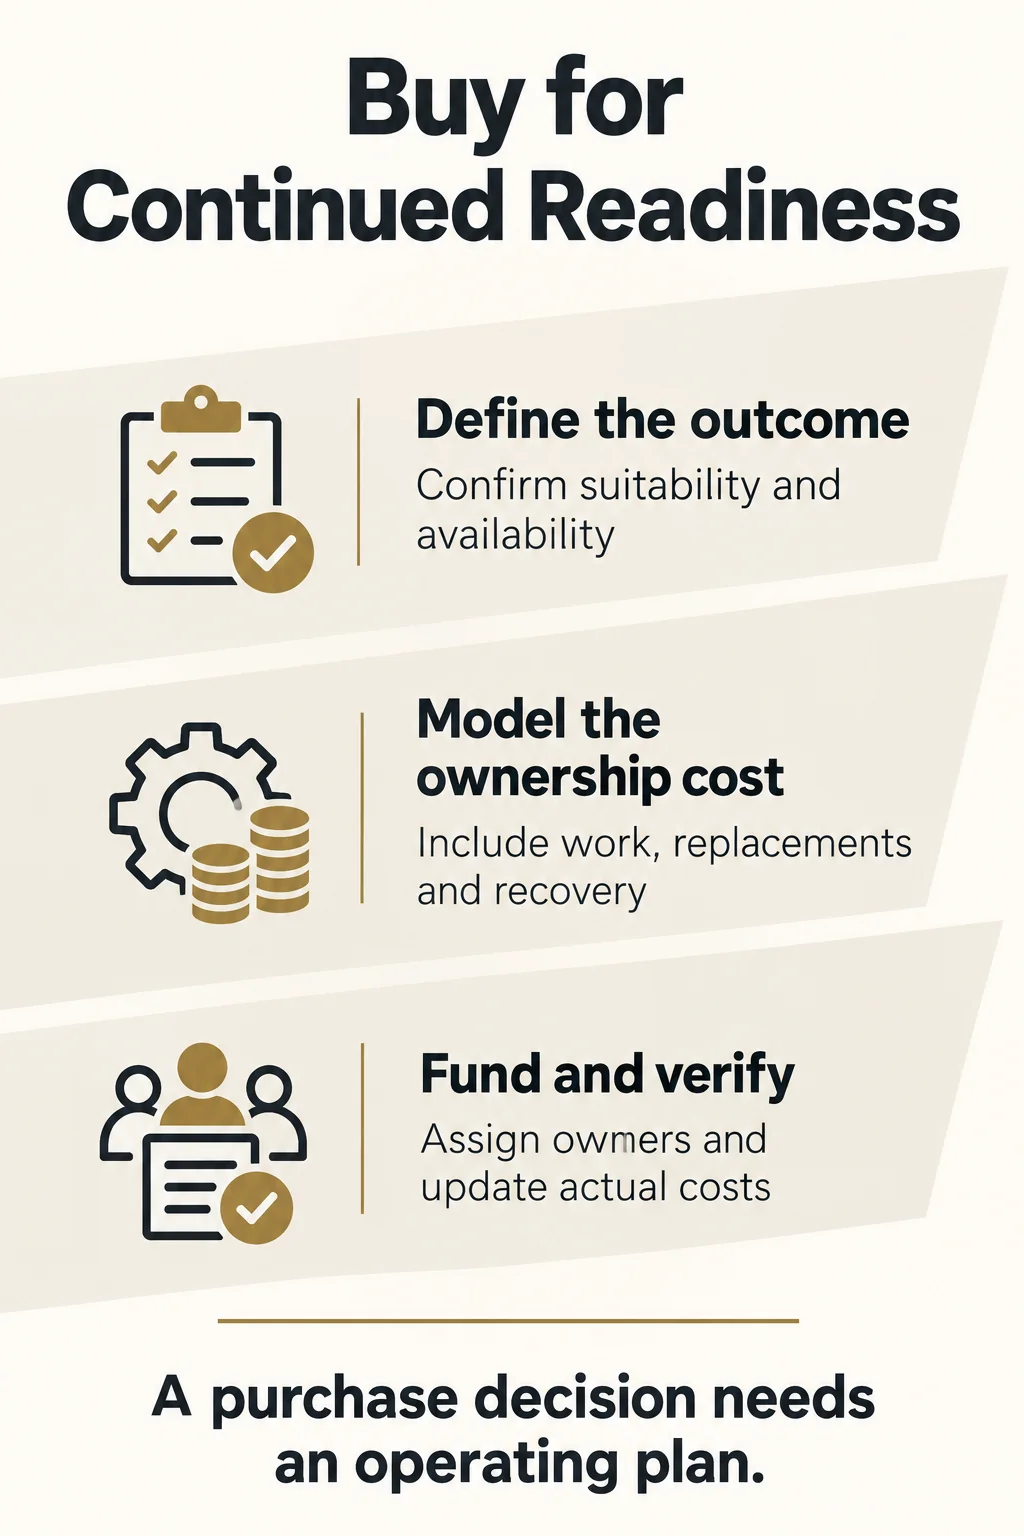
Choose accessibility supplies by the cost of maintaining an acceptable service outcome over time. A defensible five-year model starts with comparable scope, makes recurring work visible, places replacement events in the correct years, and tests the assumptions behind any claimed saving. In the illustrative comparison, the higher-priced option earns its premium only because the modeled operating and replacement differences outweigh the extra initial cost. Your property’s evidence must establish whether those differences are real. Use the workbook to make that evidence reviewable, then connect the selected option to a funded operating plan and a documented supply specification.
For a quotation aligned with your model, contact KW Hospitality with the product specifications, deployed and spare quantities, delivery location, required date, and the cost lines you need separated. Ask for clarification of unresolved service and replacement assumptions before using the quotation as an approved five-year budget.
Frequently Asked Questions
Should an existing property include the original cost of equipment it already owns?
For a decision made today, the original purchase price is a sunk cost. Compare future costs from today onward, including any real resale opportunity forgone by retaining the item. Historical spending remains useful for performance analysis, but adding it to only the keep option can distort a replace-versus-retain decision.
Can a rental option be compared with a purchased fleet?
Yes, if both options deliver the same acceptable availability and service. Include rental payments, delivery, cleaning responsibility, damage charges, minimum rental periods, and emergency extensions. A refundable deposit is not a permanent expense, but its payment and return may affect financing or cash timing. Treat purchase recoveries consistently at the same endpoint.
How should taxes and financing be handled?
Declare the basis. The example excludes recoverable taxes, income-tax effects, and loan payments. Include nonrecoverable charges in the appropriate acquisition or operating line. If finance requires an after-tax or financed comparison, build that schedule separately and keep its discount-rate basis consistent. Do not add loan principal to a TCO schedule that already counts the full asset purchase.
What if there is no reliable failure history?
Use a documented range and show which replacement patterns change the decision. Ask for written service terms and relevant performance evidence, then update the range from your own operating record. Avoid presenting a precise failure rate inferred only from a warranty period or a single approved sample.
Does a five-year horizon mean equipment should be replaced after five years?
No. The horizon fixes the comparison period. Actual replacement depends on condition, serviceability, instructions, and the property’s requirements. If continued use is acceptable and expected, include a defensible remaining-use value or extend the analysis rather than forcing an arbitrary disposal date.